

Measuring Supply Chains As a Leading Indicator of Sustainability
This article explores the relationship between a company’s supply chain standards and practices, assessed from a social and environmental perspective, and that company’s overall ESG Corporate Rating Score, which reflects how prepared that company is to tackle industry-specific risks and opportunities related to sustainability. Using the underlying data from the ESG Corporate Rating Score, the article derives […]


This article explores the relationship between a company’s supply chain standards and practices, assessed from a social and environmental perspective, and that company’s overall ESG Corporate Rating Score, which reflects how prepared that company is to tackle industry-specific risks and opportunities related to sustainability.


Using the underlying data from the ESG Corporate Rating Score, the article derives a supply chain management score by equally weighting the scores of an issuer’s social and environmental supply chain standards and practices. The resulting Combined Supply Chain Score (CSCS) is derived for 5,200 issuers across more than 50 industries globally across the entire market cap spectrum.
Calculating an issuer’s CSCS and studying this score’s relationship to the issuer’s ESG score makes it possible to understand the importance of supply chain performance as a determinant of a company’s ESG performance score. The article also analyzes the relationship of this universe’s CSCSs with its EVA margins.
Supply Chain Management
Supply chain performance reflects operational resilience, which is a key contributor to the execution of operational control. Companies with the highest supply chain scores are likely to exhibit high levels of operational resilience. Such resilience is essential to the long-term sustainability of the companies’ business and reflects better risk management processes, which are an important factor in and contributor to sustainable profitability.
Figure 1. Distribution of Companies’ ESG Scores vs Their CSCSs
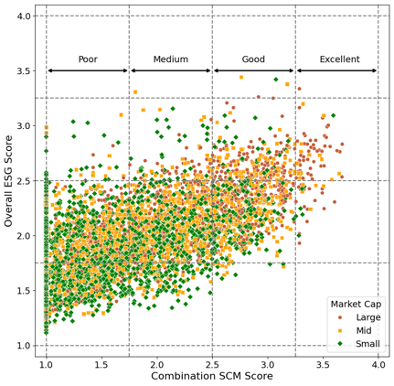
Note: Over 5,000 companies from the ISS STOXX universe are covered here. Financials are excluded due to the lower relevance of the supply chain indicators
Source: ISS STOXX
Figure 1 indicates that the distribution of CSCSs is skewed negatively: there are relatively few companies with a high combined score and a high ESG score, while there is a strong relationship between companies that score poorly from a supply chain perspective and have a poor ESG score.
Achieving a good or higher ESG score is challenging, though it is fair to expect larger market cap companies to have a higher probability of attaining a higher ESG score. This probability can be attributed to larger cap companies having a greater availability of resources dedicated to measuring and implementing sustainability processes.
Figure 2 illustrates the distribution of ESG scores and CSCSs by market cap, in line with the ISS STOXX methodology.
Figure 2: Distribution of ESG Score and Combined Score by Market Cap
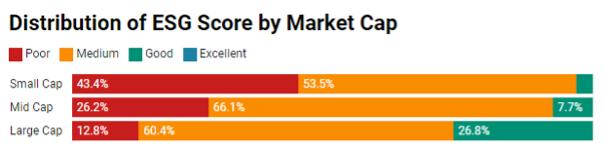
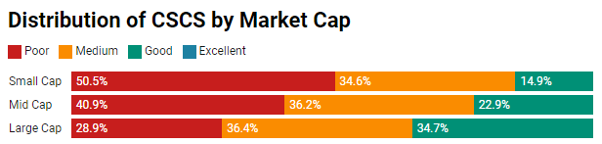
Note: CSCS = Combined Supply Chain Score
Source: ISS STOXX
The data shows that a larger proportion of Small Cap companies have Poor ESG scores and CSCSs in comparison to the proportion of Mid and Large Caps. Interestingly, there are significantly more Small Cap companies with a good supply chain score in comparison to Small Cap companies with an overall good ESG score.
Industry Perspective
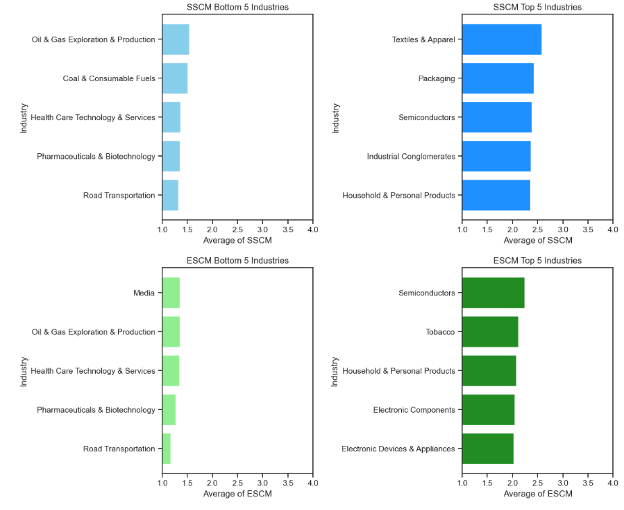
Figure 3 compares the top 5 and bottom 5 industries’ average scores from two perspectives: i) the Social Supply Chain Management (SSCM) perspective and ii) the Environmental Supply Chain Management (ESCM) perspective.
Figure 3: Top 5 and Bottom 5 Industries from a Social and Environmental Supply Chain Perspective
Source: ISS STOXX
Certain Industries appear among both the bottom SSCM and bottom ESCM scorers: Oil & Gas Exploration & Production, Health Care Technology & Services, Pharmaceuticals & Biotechnology, and Road Transportation. The industries in the top 5 SSCM and ESCM scorers are more diverse, with only Semiconductors and Household & Personal Products appearing in both rankings.
The Link with EVA
The data in Figure 4 displays financial metrics covering a 5-year period (ending in October 2024) for the issuers evaluated in this note. Issuers are grouped by their CSCSs and compared to various financial metrics. The analysis then evaluates the issuers’ EVA margins, with a positive margin indicating firms that beat their cost of capital.
Figure 4: Economic Value Added (EVA)
| CSCS | ≥2.75 | <2.75 – 1.75 | <1.75 |
| 5-year average EVA margin | 4% | 0% | -3% |
| 5-year EVA margin SD | 9% | 12% | 17% |
Note: Represented by a total of 4,849 securities delivering returns between –99% and 2600%
Source: ISS STOXX
The data illustrates a positive correlation among issuers between higher CSCSs and higher 5-year EVA margins. The companies with the highest CSCSs also have lower standard deviations (SDs) of their EVA margins.
Conclusion
Supply chain standards and procedures are core indicators showing how companies manage their operational risks. Poor adherence could indicate lower resilience and greater exposure to risks related to industrial accidents, for example, or signal weaknesses in a company’s quality-control processes.
Identifying companies exposed to higher levels of supply chain risk can add value in the thematic engagement process and fundamental analysis approach. Gaining insight into specific sustainability metrics may provide users with insight into which companies are aiming for and adhering to excellence and which companies are lagging in their disclosure, which may indicate larger-than-expected operational risks.
Explore ISS ESG solutions mentioned in this report:
- Identify ESG risks and seize investment opportunities with the ISS ESG Corporate Rating.
By:
Roberto Lampl, Managing Director, Corporate Ratings Research, Global Multi Sector Head, ISS STOXX
Moeka Inada, Associate, Corporate Ratings Research, Industrials, ISS ESG