From Net-Coal to Net-Zero: Australian States and Territories’ Path towards a Low-Carbon Economy
Introduction Climate change presents a particular challenge for Australia, given the country’s remarkable ecological diversity and its substantial dependence on natural resources, especially fossil fuels. The Australian Climate Change Act 2022 set ambitious greenhouse gas emissions reduction targets: a 43% reduction, relative to a 2005 baseline, by 2030 and Net Zero emissions by 2050. Different […]
Introduction
Climate change presents a particular challenge for Australia, given the country’s remarkable ecological diversity and its substantial dependence on natural resources, especially fossil fuels. The Australian Climate Change Act 2022 set ambitious greenhouse gas emissions reduction targets: a 43% reduction, relative to a 2005 baseline, by 2030 and Net Zero emissions by 2050. Different Australian states and territories have been making differing degrees of progress towards Net Zero, though.
The ISS ESG Country Rating and Sub-Sovereign Rating provide insights into how Australian states and territories are performing on ESG issues, including reduction of greenhouse gas emissions. Investors can draw on these insights as they evaluate ESG-related risks and opportunities in Australia.
Australia’s Carbon Profile
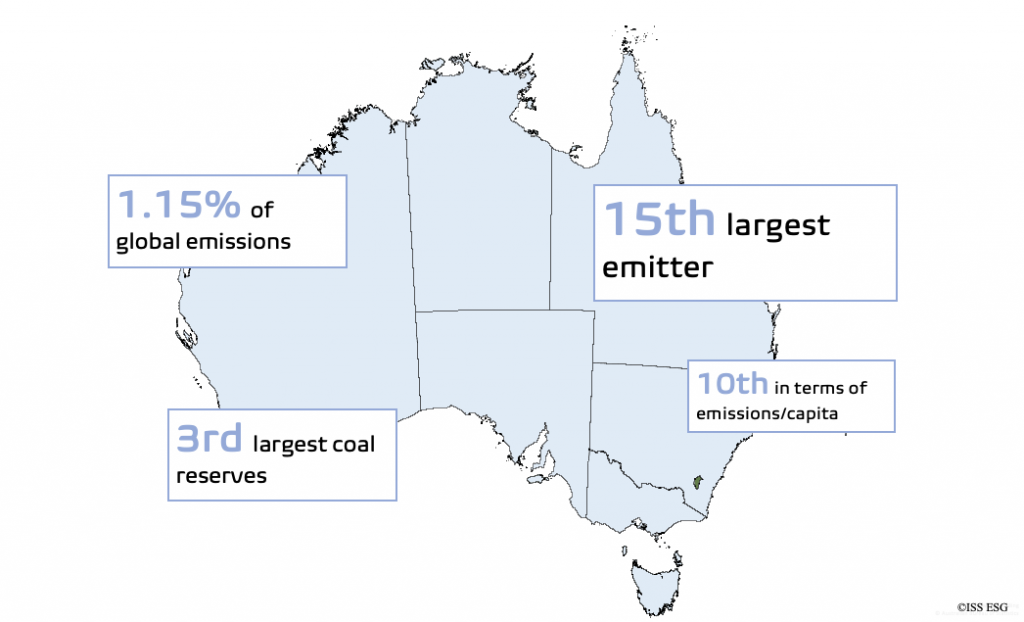
Australia is the world’s 15th largest emitter of production-based scope emissions. Australia also is the nation with the world’s third-largest reserves of coal (Figure 1). At the same time, Australia is home to one of the first regions that has frequently achieved Net Zero emissions, Tasmania.
Figure 1: Australia’s Carbon Profile, 2020
Source: ISS ESG Sovereign Dataset
In recent years, Australia has initiated efforts to actively engage in climate change mitigation. As mandated by the Climate Change Act, Australia released its inaugural Annual Climate Change Statement 2022, reporting on progress towards achieving Net Zero emissions. Efforts to achieve Net Zero encompass a range of initiatives, from the decarbonisation of the predominantly fossil fuel-powered electricity sector to the integration of climate risk management into government operations, supported by a budget allocation of $9.3 million over four years.
Australia’s complex ESG profile is reflected in its ISS ESG Country Rating grade of B-, on a scale from A+ (excellent) to D- (poor), which gives Australia Prime Status under ISS ESG methodology. The country’s performance across the ESG pillars, however, is mixed.
Australia has an Environmental score of C but exhibits better performance in its Governance (B+) and Social (B+) grades. Within the ESG Country Rating universe, Australia ranks 21st out of 179 sovereign entities.
Australia’s eight states and territories display diverging preparedness for the climate challenge at the sub-sovereign level. The ISS ESG Sub-Sovereign Rating and other data provide a sense of the varying performance of these jurisdictions in climate change-related areas.
Climate Performance of Australian States and Territories
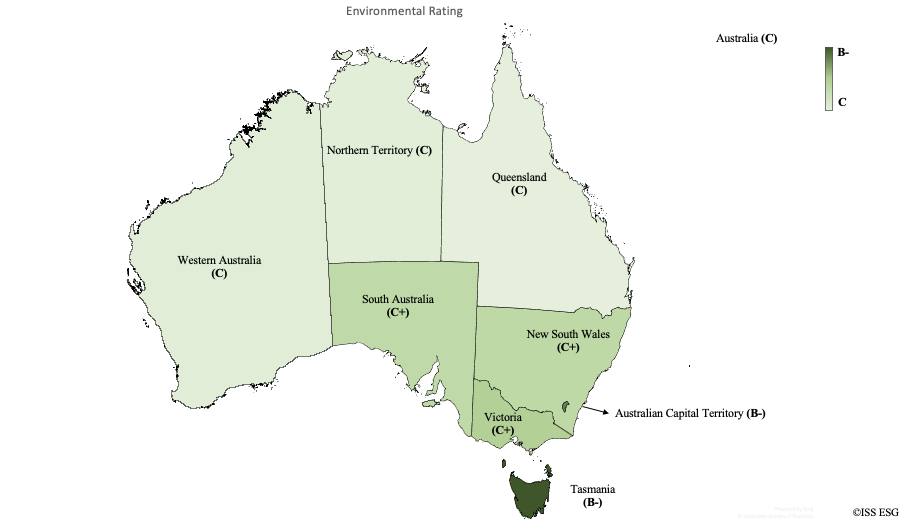
Australian states and territories differ in their environmental performance. The ISS ESG Sub-Sovereign Rating for Australia on overall environmental performance ranges (on a scale where A+ is best and D- is worst) from B- for Australian Capital Territory (ACT) and Tasmania, to C for Northern Territory, Queensland, and Western Australia (Figure 2).
Figure 2: Environmental Ratings of Australia’s States and Territories
Source: ISS ESG Sub-Sovereign Rating
Beyond overall performance, states and territories differ in their performance on specific environmental indicators, such as Climate Targets and Action Plans. Not all states and territories have set long-term emissions reduction targets consistent with limiting global warming to 1.5°C or have comprehensive climate action plans with clear implementation strategies and measurable targets and timelines.
The ISS ESG Sub-Sovereign Rating shows that New South Wales, Victoria, Tasmania, and ACT are the best performers within the country as far as comprehensively planning for emissions reduction. Queensland and South Australia, however, have room for improvement in setting policy targets for long-term emissions reduction, while the Northern Territory is lagging behind.
Other crucial indicators for Australian states and territories’ climate performance are Greenhouse Gas Emissions per GDP, Greenhouse Gas Emissions per Capita, Total Energy Mix, and Land Use.
Emissions Reductions
Scope 1 emissions, also known as “Production Emissions,” have declined by 2.4% over the past decade in Australia. These reductions vary across states and territories, however. Victoria, for instance, experienced the most substantial decrease in emissions, with a notable reduction of 23.8%. Following closely, South Australia witnessed a decrease of 14.8%, while New South Wales achieved a reduction of 11.6% (Figure 3).
Figure 3: Contribution of Each State to Australia’s Total Emissions (%)
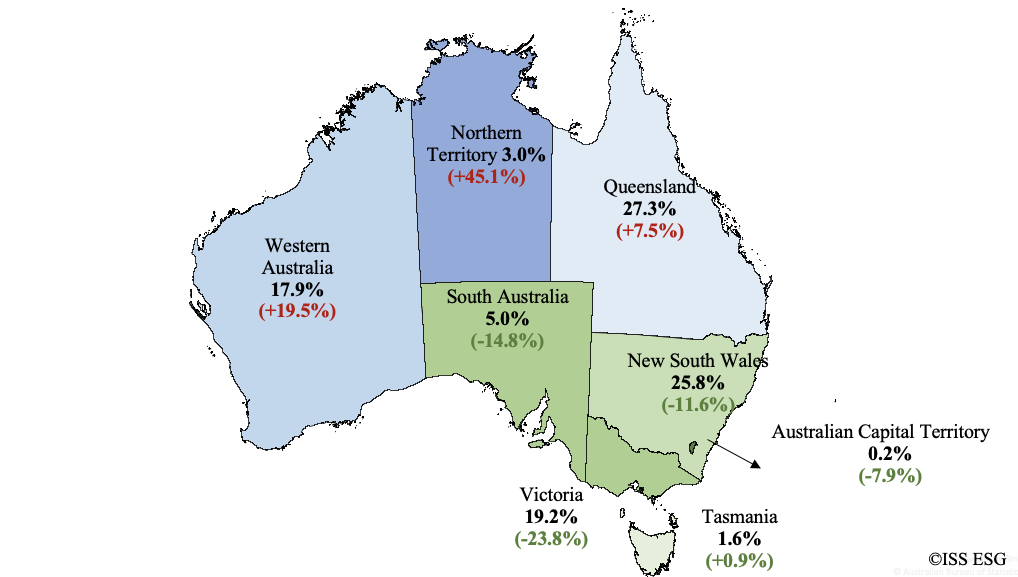
Note: Numbers in parentheses refer to the average change of emissions over the past 10 years (2021 emissions).
Source: ISS ESG Sovereign Dataset
In contrast, other states have witnessed greenhouse gas emissions increases over the past decade. The Northern Territory, for instance, experienced a notable increase of 45.1%, while Queensland has seen emissions rise by 7.5%. However, the Northern Territory contributes only 3.0% of Australia’s total GHG emissions, in contrast to Queensland, which is the largest contributor with 27.3%.
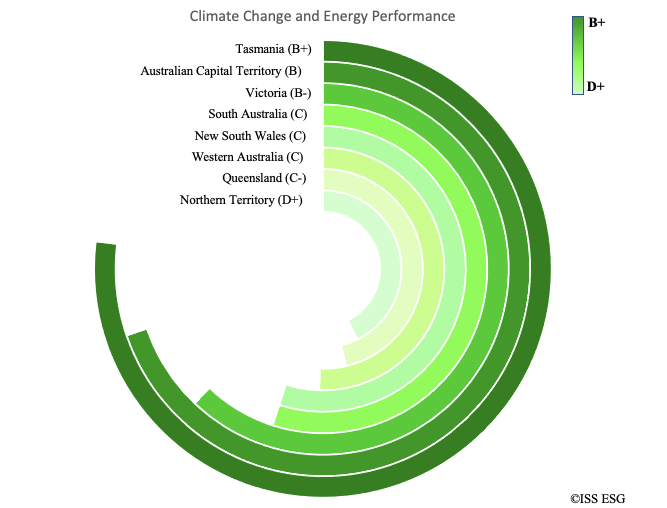
The ISS ESG Sub-Sovereign Rating reflects the varying Climate Change and Energy performance of Australian states and territories. Climate Change and Energy is a composite indicator that encompasses measures such as carbon emissions, vulnerability to climate change, and energy use (Figure 4).
Figure 4: Climate Change and Energy Performance in Australia’s States and Territories
Notes: A+ = highest rating; D- = lowest rating.
Source: ISS ESG Sub-Sovereign Rating
Taking a more granular look, Victoria’s Climate Performance grade, which takes into account the state’s greenhouse gas emissions per GDP and per capita, stands at B, positioning it among the best performers within Australia. Both South Australia and New South Wales have a Climate Performance grade of C+. The Australian Capital Territory and Tasmania exhibit the best Climate Performance scores, being graded at A- and A, respectively, which contribute to their overall good Climate Change and Energy grades (graph above).
Energy Mix
Australia’s overall Total Energy Mix grade stands at C- under the ISS ESG Country Rating because of higher shares of coal, natural gas, and oil and a still relatively low share of renewables within the country’s energy mix. The ISS ESG Sub-Sovereign Rating reflects similar performance across Australia’s states and territories, which could enhance their energy mix profiles by adopting more renewable energy and bringing down the usage of fossil fuels.
The Australian Capital Territory, Victoria, New South Wales, and Queensland all have Total Energy Mix grades of C-, precisely because of their high shares of oil, gas, or coal. The Northern Territory has a somewhat better grade of C+ due to its lack of coal use, despite its significant dependency on natural gas and oil. In contrast, Tasmania has achieved the best grade within Australia, a B grade, due to its high percentage of renewable energy: nearly 50%. However, Tasmania could still improve its grade by reducing the share of oil in its energy mix.
Overall, coal consumption per capita decreased in all states, with South Australia being the fourth state to phase out coal when its last coal-fired power plant closed in 2016, after the Australian Capital Territory, Northern Territory, and Tasmania. Queensland, the major coal producer, has announced plans to end coal-fired stations by 2035. Western Australia, home to three power stations, is expecting to retire all its stations by 2030. The state of Victoria plans for the full exit of coal power by 2035, with the aim of reaching a renewable energy target of 95% in 2035.
Victoria has demonstrated remarkable progress, exemplified by an increase over the past decade of 135.82% in renewable energy’s share of the state’s energy mix. The state has simultaneously achieved a significant reduction of 28.22% in coal consumption per capita between 2012-2013 and 2021-2022. Coal consumption is likely to be further reduced in Victoria as one of the country’s dirtiest coal-fired power stations, Yallourn, is expected to close in mid-2028: this power plant supplies 20% of Victoria’s electricity needs.
These achievements underscore Victoria’s proactive approach to transitioning towards cleaner and more sustainable energy sources. However, the state still relies on fossil fuels for 64.9% (Figure 5) of its electricity generation, highlighting the progress still to be made in the transition to a cleaner low-carbon economy.
Figure 5: Shares of Electricity Derived from Fossil Fuels and Renewable Energy, 2021-2022
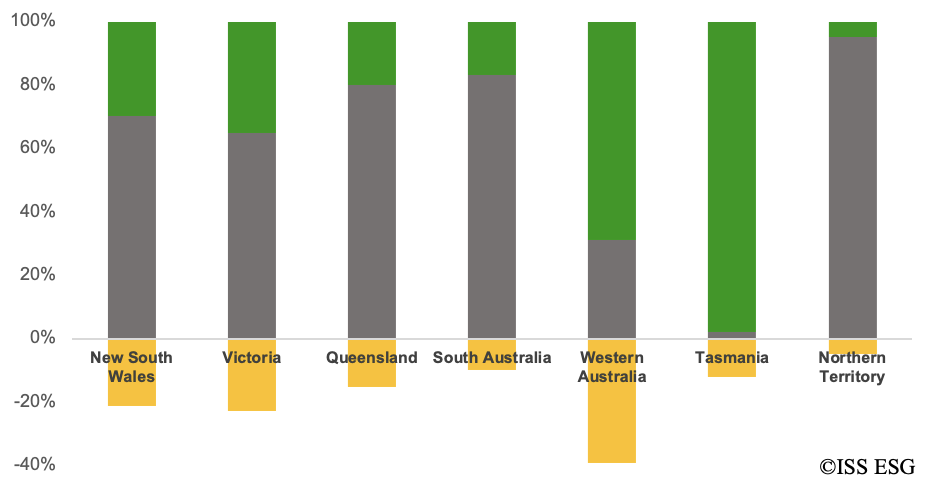
Note: Green = share from renewable energy; grey = share from fossil fuels; yellow = change in fossil fuel use over past 10 years.
Source: Australian Bureau of Statistics, ISS ESG Sovereign Dataset
The Northern Territory boasts a unique energy profile within Australia, being one of the larger states in the country but having the smallest population. The state heavily relies on fossil fuels, with approximately 95% of its electricity generated from them in 2021-2022.
Unlike other states, the Northern Territory predominantly uses natural gas and oil. The territory has the highest per capita consumption of natural gas, 18,230 kWh, and the highest per capita consumption of oil, 1,850 kWh. The state’s recent choice to expand gas production in the Beetaloo basin through fracking runs contrary to the IEA’s Net Zero Roadmap, which calls for halting all new coal, oil, and gas projects after 2020 to curb global warming within the 1.5-degree Celsius limit. Despite this, the Northern Territory aims for an ambitious target: achieving 50% renewable energy consumption in electricity by 2030.
Land Use
Among Australia’s sub-sovereign entities, Tasmania, with its substantial Share of Forest Area and small share of Artificial Land Cover resulting from human activities, performs best on sustainable land use under the ISS ESG Sub-Sovereign Rating. Victoria performs the worst within Australia, underperforming due to a bigger share of artificial land cover.
Rising emissions can be exacerbated by a notable decline in Land Use, Land Use Change, and Forestry (LULUCF) activities, a crucial sector responsible for absorbing emissions. In the Northern Territory, LULUCF emissions are no longer effectively absorbed, indicating that the carbon sink is incapable of offsetting emissions. The sink’s capability (i.e., its capacity to absorb carbon) has decreased sharply by 97.5% from 2012 to 2021. An increase in LULUCF-related emissions was observed for several years, indicating that LULUCF activities did not offset emissions. For instance, in 2014, the emissions were suddenly 1983% higher than in the previous year (2013). The decline in sink capability is largely attributed to practices such as the burning of savanna grasslands and agricultural activities (i.e., croplands, grassland, etc).
In contrast, Tasmania and Victoria possess the two largest carbon sinks in the country: LULUCF has increased their capabilities to offset emissions by 49.8% and 102.8%, respectively. LULUCF has enabled Tasmania to become the first Australian region to achieve Net Zero, absorbing more carbon than it emits.
Conclusion
Australia’s states and territories’ overall environmental performance, which includes themes such as carbon emissions, energy mix, and land use, can be differentiated under the ISS ESG Sub-Sovereign Rating. ISS ESG provides a Climate sub-sovereign dataset to help investors understand their portfolios’ emissions exposure at the sub-sovereign level.
ISS ESG data indicate that the overall environmental performance of Tasmania and the Australian Capital Territory are relatively good and are the best within the country. In contrast, states and territories such as the Northern Territory, Queensland, and Western Australia could utilize opportunities to, for example, reduce their carbon emissions or diversify their energy mix towards less carbon-intensive energy generation.
In addition to Australian climate data, a climate dataset for Canada will be available by April 15 from ISS ESG. ISS ESG aims to expand its Sovereign Dataset coverage to the most carbon-intensive countries by the end of 2024. ISS ESG also provides a Sub-Sovereign Rating for Australia, with the intention to expand the coverage to more jurisdictions after 2024.
Explore ISS ESG solutions mentioned in this report:
- Access to global data on country-level ESG performance is a key element both in the management of fixed income portfolios and in understanding risks for equity investors with exposure to emerging markets. Extend your ESG intelligence using the ISS ESG Country Rating and ISS ESG Country Controversy Assessments.
By:
Apolline Foucher, Government Climate Policy Expert, ISS ESG
Petya Barzilska, Team Lead, Sovereign Research, ISS ESG
Shivani Raheja, Analyst, Sovereign Research, ISS ESG


